Proof & Track Record
Transparency is non-negotiable. FTMO certificates, Myfxbook verification, and the full economic analysis table.
FTMO Verified
Passed the full FTMO evaluation process. Academy completed with 100% score. Real certificates, real results.

FTMO Academy — 100% Score
Apr 12, 2024
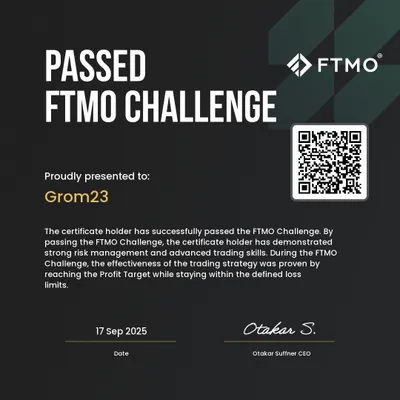
Passed FTMO Challenge
Sep 17, 2025
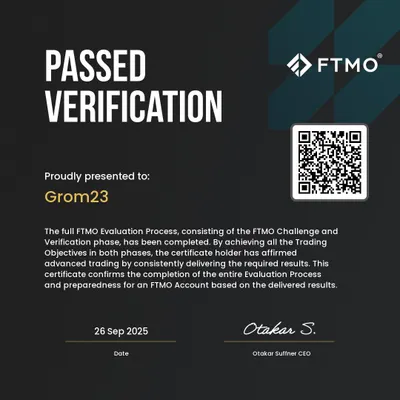
Passed Verification
Sep 26, 2025
FTMO Live Metrix
Real-time FTMO account performance. Click to verify live trading results.
Verified on Myfxbook
Third-party tracking pages. Click through to verify broker connection + trade history.
GBPUSD
GBPUSD v2.45 (Account 1)
https://www.myfxbook.com/members/Grom23/mister-lucky-rich-gbpusd-v245/11611205
GBPUSD v2.45 (Account 2)
https://www.myfxbook.com/members/Grom23/mister-lucky-rich-gbpusd-v245/11611212
Mister Lucky Rich EA v2.45 Economic Analysis
Backtest: Jul 2025 - Feb 2026 | $10,000 start | 6 configs. Best value per row in gold.
| Metric | GBPUSD+EURUSD 0.4 | GBPUSD+EURUSD 0.5 | EURUSD Only 0.5 | EURUSD Only 1.0 | GBPUSD Only 0.5 | GBPUSD Only 1.0 |
|---|---|---|---|---|---|---|
| Total Trades | 139 | 265 | 132 | 54 | 149 | 75 |
| Trading Period (days) | 220 | 224 | 224 | 217 | 222 | 218 |
| Starting Balance ($) | 10000 | 10000 | 10000 | 10000 | 10000 | 10000 |
| Net Profit ($) | 2802.4 | 3055 | 4706.76 | 2753.94 | 502.8 | 3157.54 |
| ROI (%) | 28 | 30.5 | 47.1 | 27.5 | 5 | 31.6 |
| Monthly ROI (%) | 3.8 | 4.1 | 6.3 | 3.8 | 0.7 | 4.3 |
| Gross Profit ($) | 9686.1 | 17574.41 | 10867.33 | 8660.11 | 9186.25 | 10781.99 |
| Gross Loss ($) | -6343.75 | -13385.41 | -5582.95 | -5449.64 | -8064.1 | -7018.22 |
| Profit Factor | 1.53 | 1.31 | 1.95 | 1.59 | 1.14 | 1.54 |
| Win Rate (%) | 64.7 | 60.8 | 68.9 | 64.8 | 60.4 | 64 |
| Wins / Losses | 90 / 49 | 161 / 104 | 91 / 41 | 35 / 19 | 90 / 59 | 48 / 27 |
| Avg Win ($) | 107.62 | 109.16 | 119.42 | 247.43 | 102.07 | 224.62 |
| Avg Loss ($) | -129.46 | -128.71 | -136.17 | -286.82 | -136.68 | -259.93 |
| Win/Loss Ratio | 0.83 | 0.85 | 0.88 | 0.86 | 0.75 | 0.86 |
| Largest Win ($) | 281 | 512 | 374.3 | 543 | 283.06 | 543 |
| Largest Loss ($) | -160 | -310.26 | -161.98 | -309.39 | -173 | -320 |
| Total Pips | 875.2 | 1008.7 | 1172.4 | 366.7 | 348.3 | 437 |
| Avg Pips/Trade | 6.3 | 3.8 | 8.9 | 6.8 | 2.3 | 5.8 |
| Max Drawdown ($) | -1157.3 | -1441.82 | -774.46 | -1716.4 | -1428 | -1830.46 |
| Max Drawdown (%) | -11.6 | -14.4 | -7.7 | -17.2 | -14.3 | -18.3 |
| Recovery Factor | 2.42 | 2.12 | 6.08 | 1.6 | 0.35 | 1.72 |
| Expectancy ($/trade) | 24.05 | 15.81 | 40.03 | 59.45 | 7.53 | 50.18 |
| Annualized Sharpe | 2.71 | 1.72 | 4.05 | 2.77 | 0.47 | 2.76 |
| Sortino Ratio | 5.06 | 2.82 | 8.17 | 4.88 | 0.74 | 4.91 |
| Max Consecutive Wins | 10 | 10 | 11 | 8 | 7 | 10 |
| Max Consecutive Losses | 5 | 5 | 4 | 3 | 4 | 4 |
| Commission ($) | -445.9 | -941.5 | -462 | -378 | -521.5 | -525 |
| Swap ($) | -94.05 | -192.5 | -115.62 | -78.53 | -97.85 | -81.23 |
Backtest results are historical. Live performance can differ due to spreads, slippage, execution, and regime changes.
⚠️ Disclaimer: Past performance does not guarantee future results. Trading involves substantial risk of loss. Not financial advice.